Coordinates System
The size of a page of a Document can be obtained in the Document object. The format is [width, height].
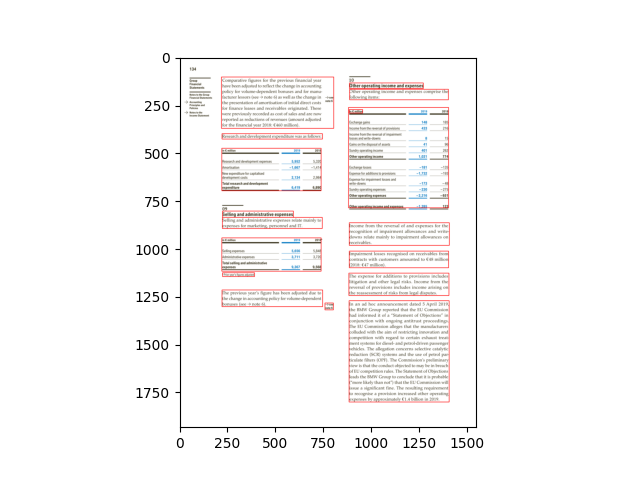
Original size of the Document is the size of the uploaded Document (which can be a PDF file or an image). The bounding boxes of the Annotations are based on this size.
E.g.: [1552, 1932]
Current size can be accessed via calling height and width from the Page object. They show the dimensions of the
image representation of a Document Page. These representations are used for computer vision tasks and the SmartView.
E.g.: [372.48, 463.68]
from konfuzio_sdk.data import Project

my_project = Project(id_=YOUR_PROJECT_ID)
# first Document uploaded
document = my_project.documents[0]
# index of the Page to test
page_index = 0

width = document.pages()[page_index].width
height = document.pages()[page_index].height
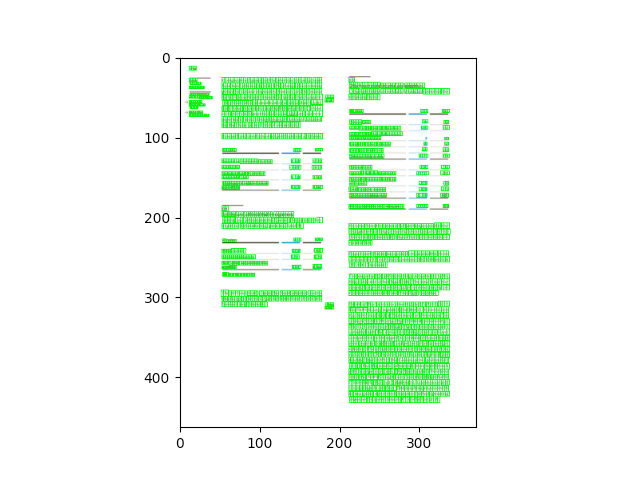
The coordinates system used has its start in the bottom left corner of the page.
To visualize the character bounding boxes of a document and overlapping them in the image opened with the python library PIL, for example, we can resize the image to the size in which they are based (original_size). The following code can be used for this:
from PIL import ImageDraw

from konfuzio_sdk.data import Project

my_project = Project(id_=YOUR_PROJECT_ID)
# first Document uploaded
document = my_project.get_document_by_id(YOUR_DOCUMENT_ID)
document.update()
document.get_bbox()
# index of the Page to test
page_index = 0
width = document.pages()[page_index].width
height = document.pages()[page_index].height
page = document.pages()[page_index]
image = page.get_image(update=True)
factor_x = width / image.width
factor_y = height / image.height
image = image.convert('RGB')
image = image.resize((int(image.size[0] * factor_x), int(image.size[1] * factor_y)))
height = image.size[1]
image_characters_bbox = [char_bbox for _, char_bbox in page.get_bbox().items()]

draw = ImageDraw.Draw(image)
for bbox in image_characters_bbox:
    image_bbox = (
        int(bbox['x0']),
        int((height - bbox['y1'])),
        int(bbox['x1']),
        int((height - bbox['y0'])),
    )
    draw.rectangle(image_bbox, outline='green', width=1)

image

# Note: cv2 has the origin of the y coordinates in the upper left corner. Therefore, for visualization, the
# height of the image is subtracted to the y coordinates.
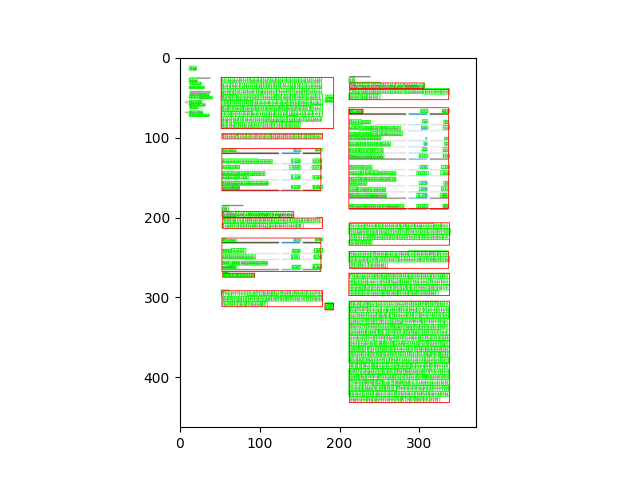
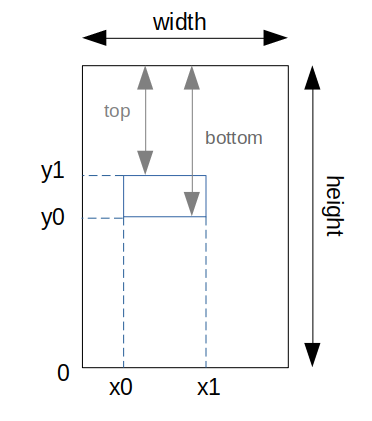
The coordinates obtained from the segmentation endpoint of the API are based on the image array shape. To visualize the segmentation bounding boxes of a page on an image opened with the python library PIL, for example, we can overlap them directly.
from PIL import ImageDraw

from konfuzio_sdk.api import get_results_from_segmentation
from konfuzio_sdk.data import Project

my_project = Project(id_=YOUR_PROJECT_ID)
# first Document uploaded
document = my_project.get_document_by_id(YOUR_DOCUMENT_ID)
# index of the Page to test
page_index = 0
page = document.pages()[page_index]
image = page.get_image(update=True)
image = image.convert('RGB')
draw = ImageDraw.Draw(image)
image_segmentation_bboxes = get_results_from_segmentation(document.id_, my_project.id_)

for bbox in image_segmentation_bboxes[page_index]:
    image_bbox = (
        int(bbox['x0']),
        int(bbox['y0']),
        int(bbox['x1']),
        int(bbox['y1']),
    )
    draw.rectangle(image_bbox, outline='red', width=1)

image
To visualize both at the same time we can convert the coordinates from the segmentation result to be based on the image size used for the characters’ bbox.
from PIL import ImageDraw

from konfuzio_sdk.api import get_results_from_segmentation
from konfuzio_sdk.data import Project

my_project = Project(id_=YOUR_PROJECT_ID)
# first Document uploaded
document = my_project.get_document_by_id(YOUR_DOCUMENT_ID)
# index of the Page to test
page_index = 0

width = document.pages()[page_index].width
height = document.pages()[page_index].height

page = document.pages()[page_index]
image = page.get_image(update=True)

factor_x = width / image.width
factor_y = height / image.height

image = image.convert('RGB')

image = image.resize((int(image.size[0] * factor_x), int(image.size[1] * factor_y)))
height = image.size[1]

image_characters_bbox = [char_bbox for _, char_bbox in page.get_bbox().items()]

draw = ImageDraw.Draw(image)

for bbox in image_characters_bbox:
    image_bbox = (
        int(bbox['x0']),
        int((height - bbox['y1'])),
        int(bbox['x1']),
        int((height - bbox['y0'])),
    )
    draw.rectangle(image_bbox, outline='green', width=1)

image_segmentation_bboxes = get_results_from_segmentation(document.id_, my_project.id_)

for bbox in image_segmentation_bboxes[page_index]:
    image_bbox = (
        int(bbox['x0'] * factor_x),
        int(bbox['y0'] * factor_y),
        int(bbox['x1'] * factor_x),
        int(bbox['y1'] * factor_y),
    )
    draw.rectangle(image_bbox, outline='red', width=1)

image

# Note: cv2 has the origin of the y coordinates in the upper left corner. Therefore, for visualization, the
# height of the image is subtracted to the y coordinates.